
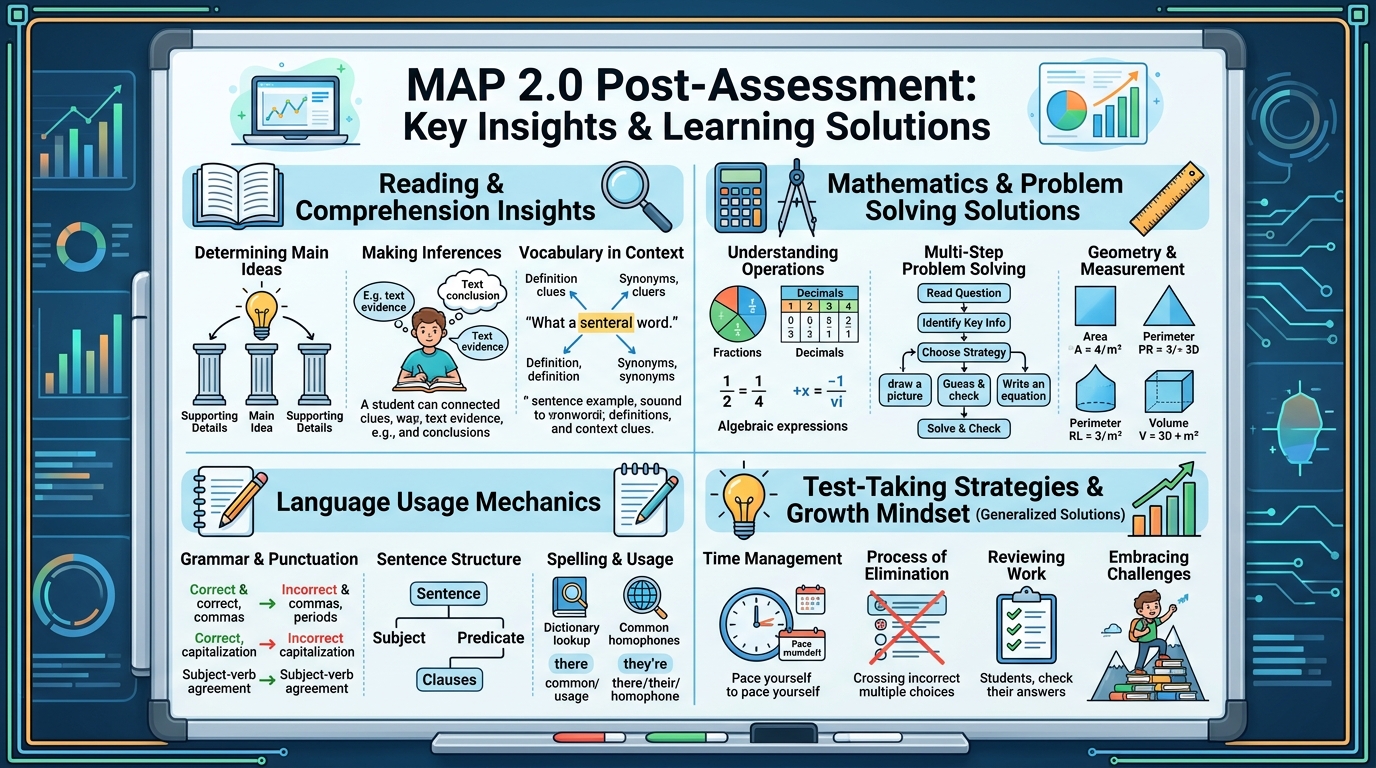
Parents and students searching for map 2.0 post assessment answers usually want one thing: clarity. However, the honest answer is simpler than most people expect, and it is also more useful. There is no fixed answer sheet for MAP Growth, because the test is computer-adaptive. Consequently, no two students see the exact same set of questions, even within the same classroom. Instead of a list of correct responses, what a student receives afterward is a detailed score report. That report explains current achievement, growth over time, and specific skill areas that need attention. This article breaks down what that report actually contains, why the test works the way it does, and how families can use the results effectively.
Why There Is No Universal Answer Key
MAP Growth, developed by NWEA, adjusts its difficulty in real time based on how a student responds. When a student answers a question correctly, the next question typically becomes harder. Conversely, an incorrect answer usually leads to an easier question next. Because of this adaptive structure, the test zeroes in on each student’s true skill level within just a handful of questions. As a result, two students sitting side by side in the same grade and subject will likely encounter entirely different question sets. Therefore, a single master answer key simply cannot exist for this kind of assessment. Understanding this distinction early prevents unnecessary frustration during the search for results.
Additionally, this adaptive design serves a specific purpose beyond simple scoring. It allows the test to measure a wide range of ability levels accurately, from students who are significantly behind grade level to those who are well ahead. Meanwhile, a fixed-question test would either be too easy for advanced students or too difficult for struggling ones. So while the lack of a traditional answer key can feel unfamiliar at first, it actually reflects a more precise measurement approach.
What Families Actually Receive After Testing
Instead of a graded answer sheet, most schools distribute a summary report once testing concludes. This report typically includes a RIT score, a percentile ranking, and a breakdown of performance across skill areas within the subject tested. Furthermore, many reports include a comparison between the current score and previous testing periods, which helps illustrate growth over time. NWEA’s Family Guide to MAP Growth outlines the general format schools tend to follow when sharing these results with parents.
Because the report format can vary slightly between districts, it helps to ask a teacher or counselor for a walkthrough if anything seems unclear. Nevertheless, most reports share a similar structure: an overall score, a visual comparison to grade-level norms, and specific strand-level detail showing where a student is strongest and where more support is needed. This structure exists precisely so families can move past the question of “what did my child get right or wrong” and instead focus on “what does this mean for next steps.”
Understanding the RIT Score
The RIT score, short for Rasch Unit, sits at the center of every MAP Growth report. Unlike a percentage or letter grade, the RIT scale functions more like a ruler with consistent, equal intervals between every point. This means the distance between a RIT score of 190 and 200 represents the same amount of academic growth as the distance between 210 and 220, regardless of a student’s starting point. Because of this consistency, the RIT scale can be used to track a single student’s progress across different grades and testing seasons.
Educators sometimes describe the RIT score as a “you are here” marker on a much longer academic path. In other words, it does not represent mastery of a fixed set of content. Rather, it reflects where a student currently stands in terms of skill difficulty they can handle with reasonable success. Since the scale stays consistent over time, families can compare fall, winter, and spring results directly to see genuine growth, not just a shift in test difficulty or format.
How Percentiles Add Context to the Score
While the RIT score shows where a student stands on an absolute scale, the percentile rank shows how that score compares to other students nationally in the same grade. For example, a student in the 65th percentile scored higher than 65 percent of peers who took the same assessment during a similar testing window. This comparison offers useful context, particularly for families trying to understand whether a score reflects typical performance, an area of strength, or a potential gap.
That said, percentiles should never be read in isolation. A student might have a strong RIT score yet still fall in an average percentile range simply because their entire grade performed well overall. Similarly, growth between testing periods often matters more than a single percentile snapshot, especially for tracking whether interventions or additional support are working as intended. Consequently, most educators recommend looking at percentile trends across multiple seasons rather than reacting to one isolated number.
Breaking Down Subject-Specific Results
MAP Growth typically assesses several subjects independently, most commonly mathematics, reading, language usage, and occasionally science. Each subject produces its own RIT score and its own set of skill-area breakdowns, since strength in one subject does not necessarily predict performance in another. Within mathematics, for instance, a report might separate results into areas such as algebraic thinking, geometry, and data analysis, allowing families to see precisely which concepts need reinforcement.
Similarly, reading reports often distinguish between literary comprehension, informational text analysis, and vocabulary usage. This granular breakdown matters because two students with an identical overall RIT score in reading might have very different underlying skill profiles. One might excel at vocabulary but struggle with informational texts, while another shows the reverse pattern. Therefore, reviewing the subject-specific detail, rather than focusing solely on the overall score, gives a far more accurate picture of where a student needs help.
What to Do With the Results
Once the report arrives, the most productive step is turning the data into a plan rather than searching for missed questions. Teachers frequently use MAP results to group students for targeted instruction, adjust pacing, or identify students who may benefit from additional enrichment. At home, parents can use the skill-area breakdown to guide conversations with teachers about specific support strategies, whether that means extra reading practice or reinforcement in particular math concepts.
It also helps to remember that a single test represents one data point among many. Classroom performance, homework patterns, and teacher observations all contribute additional context that a standardized score cannot fully capture on its own. Consequently, families should treat MAP results as one useful piece of a larger picture rather than a definitive verdict on a student’s abilities. Combining this data with regular communication with teachers tends to produce the most meaningful outcomes.
Common Misunderstandings About MAP Testing
Many parents assume a lower-than-expected score signals a problem, when in fact the adaptive format can produce results that feel unfamiliar compared to a standard graded exam. Because the test continuously adjusts difficulty, a student who works through many challenging questions may actually be performing exceptionally well, even though the experience felt difficult. This is an important distinction, since a difficult test session often indicates the algorithm accurately identified a strong skill level, not that something went wrong.
Another common misunderstanding involves comparing scores across different students without accounting for grade level or testing season. Since the RIT scale is not tied to a specific grade in the same way a percentage grade is, direct comparisons between students in different grades require careful interpretation. Additionally, some families expect immediate, dramatic score changes between testing periods, but meaningful academic growth typically unfolds gradually across an entire school year rather than in a single testing cycle.
How Schools Use MAP Data Beyond Individual Reports
Beyond individual student reports, schools often aggregate MAP data to evaluate broader instructional trends. Administrators may review grade-level averages to determine where curriculum adjustments could help, while teachers use classroom-level data to identify which concepts need additional review time. This wider use of the data underscores why the assessment exists in the first place: not to produce a single answer key, but to generate ongoing, actionable insight for both individual students and entire instructional programs.
Furthermore, many districts use MAP results alongside other assessments to build a more complete picture of student achievement. Standardized state tests, classroom assignments, and teacher evaluations all complement the growth-focused data that MAP provides. As a result, no single score, including a MAP RIT score, should be treated as the sole measure of a student’s academic standing.
Final Thoughts on Interpreting MAP 2.0 Results
Ultimately, the search for map 2.0 post assessment answers often reflects a desire for reassurance and clarity rather than a literal answer sheet. Fortunately, the score report provides exactly that, just in a different format than a traditional test review. By focusing on the RIT score, percentile context, and subject-specific skill breakdowns, families can gain a genuinely useful understanding of where a student stands and how they are progressing over time. Rather than searching for missed questions, the most productive approach involves reviewing the report with a teacher, identifying specific areas for growth, and tracking progress across future testing seasons. This shift in perspective, from seeking fixed answers to understanding meaningful data, ultimately serves students far better in the long run.